Glide · Science
Can AI count carbs?
Glide's photo carb estimator, measured · evaluation runs of 30 September 2026
Every insulin dose starts with a carb count. Count too low and glucose spikes; count too high and the extra insulin causes a low. People with type 1 diabetes counting by hand miss by 15.4 g on average, on meals that averaged 72 g (Brazeau et al.).
In Glide you photograph the food, and AI proposes a carb count and a description. You review and edit it before anything is logged. This page shows what goes wrong with a plain AI answer, how we test, and how the models have improved.
1. Why not just ask a chatbot?
Some AI models we tested put 40 to 80 g of carbs on a plate of sausage with under 2 g. A bolus for that number would push glucose low. Any chatbot gives you a number for a food photo, and nothing tells you when the number is that far off.
We also asked the model Glide uses, Gemini 3.8 Flash, the plain question “How many grams of carbohydrates are in the food in this photo?” on our 90 test photos. It missed by 16.6 g on average, mostly because it counted some packages whole: 420 g for a 10-pack box of bars whose label says 40 g per bar. With Glide's instructions, the same model misses by 8.3 g.
2. How we test
Every candidate model answers the same photos, each with a known carb count:
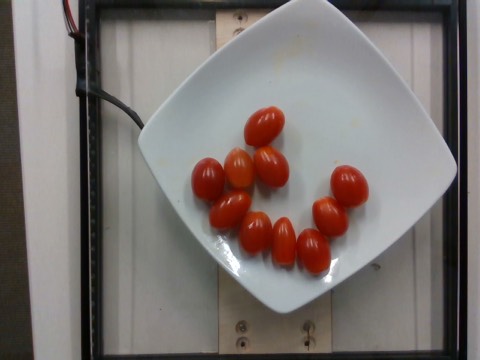
- 300 plated dishes from Nutrition5k, each ingredient weighed in a lab.
- 200 packaged products from Open Food Facts, scored against the printed label.
- 19 home meals we weighed ourselves and photographed on a phone.
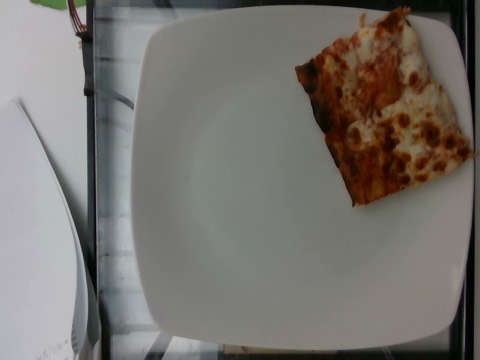
- 27 everyday photos from our own family's log, the foods we snap most (croissants, bagels, ice cream, ramen, sushi, cereal), hand-labeled. None shows a person.
- 6 product photos from makers that publish the carbs for that exact portion.
What the test data looks like

“I also drank a juice box with 15 g of carbs. Add it.”
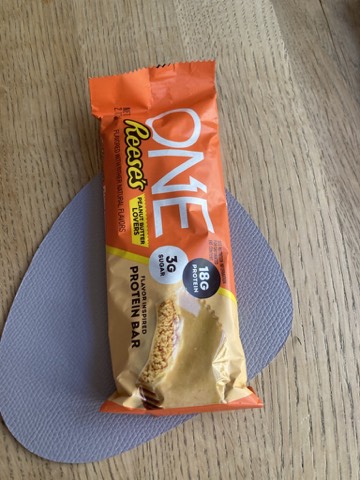
Plated photos from Nutrition5k; packaged photo by Open Food Facts contributors (CC BY-SA). The home example is a product shot from our own set.
What we measure
- The average miss, in grams, and how big it is compared with the meal.
- Blunders: a miss of more than half the meal, such as 10 g on a cheese stick. Averages hide these, so we count them one by one. The worst kind is carbs on a food that has almost none, and a model that does that does not ship.
- Every photo, both models. A new model is compared with the current one photo by photo, so a better score is not luck in which photos were easy.
- Latency. How long an answer takes, including the slow ones.
- The labels themselves. A review of the packaged set once found wrong labels; fixing them, not the model, moved that set's average miss from 4.7 g to 3.5 g.
3. Results over time
We pick a model in two steps. First every candidate answers a short set of 90 photos. Then the most promising ones answer about 500 more, which narrows the error ranges enough to tell close models apart. Glide uses Gemini 3.8 Flash.
Step 1: every model, 90 photos
P50
Models in the order they came out, all with the same instructions. Average miss in grams, and the share of photos with a blunder (a miss of more than half the meal); shorter is better. The thin lines show the 95% range of each number: where two ranges overlap, the difference could be chance. Latency is measured from our computer through the same service the app uses. Gemini 2.5 Flash Lite is left out: it gave no answer on 17 of the 90 photos.
Step 2: finalists, 494 photos
The finalists of each round on the same 494 photos: 299 lab-weighed dishes and 195 packaged products, scored against today's labels. Each round ran all its finalists with the same version of Glide's instructions. In June, Gemini 3.5 Flash was clearly ahead. In September, Gemini 3.7 and 3.8 Flash tied on accuracy, and 3.8 answered faster (4.0 s against 4.7 s typical) with no failed answers.
Glide's numbers today
| Test set | Average miss |
|---|---|
| Plated dishes300, average meal 35 g | 11.1 g |
| Packaged, per serving200, average serving 22 g | 2.8 g |
| Home meals19, average meal 17 g | 1.0 g |
| Family log photos27, average meal 36 g | 5.8 g |
| Typed corrections313 scripted edits, such as “add an apple” | 1.6 g |
| LatencyP50 | 4.0 s |
We keep working on both numbers, accuracy and latency, and this page gets the new results as each round of tests finishes. If you know the meal better than the model, your number wins.
Also on the science shelf: the glucose forecast → Why Glide shows a “do nothing” projection with a measured uncertainty cone, and refuses to chase accuracy scores.Glide displays data from a third-party CGM and is not affiliated with or endorsed by Dexcom, Abbott or Medtrum. Not a medical device; not medical advice. Questions about the method? feedback@glidebg.com